 |
| You Know It's Conservative 'Cause It's Red, White, and Blue! |
I. Presidential Job ApprovalJob Approval is the one statistic that most closely correlates to actual vote totals for an incumbent president. As such, it is an integral part of my formula. Up to twelve job approval polls are used, and only polls conducted less than two weeks prior to the most recent poll will be used.
II. Adjusted National Polling DataUp to twelve national polls are used to compute an average national margin between Barack Obama and Mitt Romney. Only polls two weeks old or less will be used. The average national margin is then subtracted from the national 2008 result to arrive at the national polling data adjustment. This adjustment is then added to the 2008 margin in each state, yielding the national polling factor for the state.
III. State Polling Data
The aggregate average of polling data is used in the following manner:They also get rid of "outlier" polls through a process discussed on the linked page.
- At most, six polls from a state are used.
- In the interest of currency, only polls conducted within thirty days of the date of the present projection will be used. Non-competitive states may be exempted from this time limit. (Note: Closer to the election, this 30-day limit will be reduced to two weeks.).
What are their results? You can read them here. They were off (in the 2008 election) by about 30 EV (two states) and about .40% popular vote. They had two states for McCain (Indiana, North Carolina) that didn't pan out.
Another nice thing Election Projection does is give a summary of the last round of polling with who it helped:


What Does It Mean?
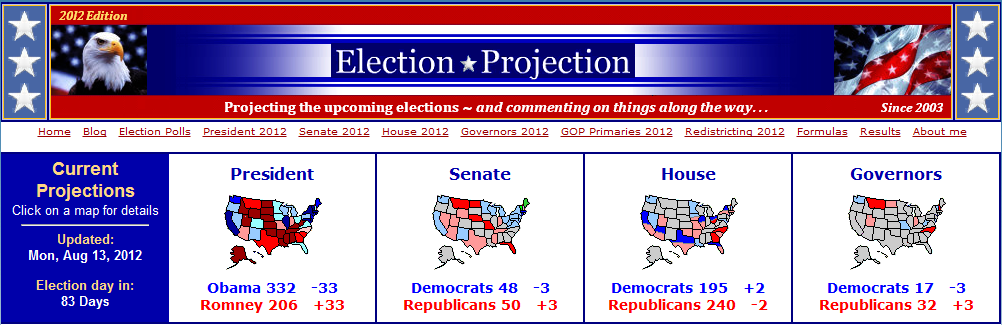
Election Projection doesn't really give a %-chance of victory in November--just a snapshot of where we are now but it's telling anyway: if Obama is really "walking around" with something like 332 EV from the perspective of a guy who is a hard-core conservative then I think it's pretty clear that he's ahead--regardless of what Rasmussen says.
I have seen suggestions that throwing out outliers is exactly the wrong thing to do--and suggestions that adding in other factors (favorability, for example) also muddies the waters by adding noise and increasing the "value" of things (such as: "I don't like the job Obama is doing") that are already "priced in" to the original poll result. Could be.
Statistically speaking Election Projection was really close to the real results--but as I've said, everyone was pretty close by the last few days. The real questions for these sites is:
- How subject to change are the current numbers (i.e. who is still undecided--how much money is "still on the table"?)
- What markets, areas, and demographics are likely to make up a shift between now and November?
- What "magnitude" of black-swan event would it take for a reversal? Would it take another Lehman Brothers collapse to change things around or will a few strategic mistakes swing things?
My gut feeling is that this election has been remarkably stable, we are told "almost everyone" has made up their minds already, and despite the press throwing various fits the aggregate effect of gaffes hasn't moved things much.
Election Projection (and Electoral Vote) don't really tell us that--there are some sites that do--and we'll look at them shortly!
What Do I Think?
I think it's great to have an openly conservative site doing this math: Nate Silver skews left (says I--but it's not anywhere explicitly on his site unless you count the New York Times banner at the top) and so does Electoral-Vote.com (and by "skews left" I mean the people who run them are more democrat in their personal politics--NOT that they are skewing their numbers). Having a conservative analyst whose numbers are roughly in line with what everyone else is showing gives me confidence that, for example, the polling system is not broken or that election analysis has been totally devoured by the MainStream Media (weird caps because it is abbreviated MSM).
No comments:
Post a Comment