- The polls lie. They are, perhaps, run by liars.
- They do not accurately measure anything--until, perhaps--the last week or so when pollsters give up on their ideological crusades and try to tighten up their polls to save their agencies.
If you think I am making this up or exaggerating, go to any political blog with a lot of comments and read them on a day when a poll antithetical to their candidate comes out.
The more sophisticated version is this: (1) polls tend to over-sample the "other guys" and therefore, if you have a poll that shows Candidate X ahead by 4 and they sampled 37% X's and only 22% Y's that means that rather than being a good poll this means that (2) since there about equal X's and Y's (and also 33% independents) this means that, hey, despite what the Main-Stream-Media headline says, it's actually a good poll for Y!! It showed X was up by 4% but they had to ask 15% more X's to get that number!!
This ignores that the polling group corrects for what they think the real percentages are. They don't just use what they got on the phone and assume it's the real distribution. Those "real values" may be off but they come from pretty generic data-sets--not (generally) intensely partisan ones (the census, etc.).
But regardless: there's a rule in polling analysis: just keep averaging the polls you've got.
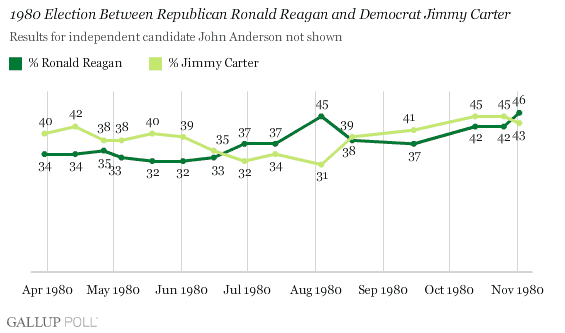
Let's look at this with the 1980's Reagan election. Here is Gallup's poll:
 |
| Bowers is a Daily Kos Guy--but I only saw it because RT by Sean Trende who agrees (for your bi-partisan satisfaction) |
 |
| Gipper Takes It At The Last Moment! |
This is what I'm sayin' if I'm Romney: Look at that--polls--even Gallup--shows Carter up by +1 ... +4 ... +3 ... +3 ... -9 FOR THE WIN. So okay, yeah: and that date? That's like right before the election happened. Switcharoo.
Here's the average of 1980's polling:
 |
| Not Quite The Same Story |
I want to note that is analysis comes from The Monkey Cage which is pretty much stunning in how interesting it is. I wouldn't have written anything if they'd actually posted the Gallup poll graph instead of just linking to it.
What Can I Add?
I think the lesson here is that big-data tends to win: the human analysis of Carter is that the 11th hour decision by Iran not to release the hostages turned things around just before the clock stuck midnight. It turns out that's not the case: yes, Reagan surged--but it only added to his fundamental lead. The story that Romney is telling its supporters is, this analysis suggests, not the real story. This is the "today" view of the above:
As of this date (a) there are many, many more polls and (b) Romney, while not far behind (for most of it) has not led save for a tiny slice around early May. I had questioned the Reagan narrative in that I have never felt that Romney = Reagan (although I'll admit I can see, at least, some parallels to Obama = Carter). Looking at this analysis I'm finding the Romney-wins-like-Reagan-did story even less compelling.
No comments:
Post a Comment